---
tytul: "Page Load Speed: How to Make Your Website Faster"
opis: "Measure your page load time with several tools: PageSpeed Insights, GTmetrix, Pingdom, Lighthouse and GA4. Learn how to use them in this guide."
adres: https://justidea.agency/en/blog/how-to-improve-page-load-speed/
serwis: "JustIdea Agency"
jezyk: pl
zrodlo: automatyczny odpowiednik strony HTML, generowany przy każdym buildzie
---
Article

# Page Load Speed: How to Make Your Website Faster

 Measure your page load time with several tools: PageSpeed Insights, GTmetrix, Pingdom, Lighthouse and GA4. Learn how to use them in this guide.

[![Wojciech Wabno](https://justidea.agency/obrazy/wojtek-240x300-42c3ca11.webp) Wojciech Wabno SEO Specialist](https://justidea.agency/en/author/wojciech-wabno/) 18 April 2024 30 min read 26 sections


 ![Page Load Speed: How to Make Your Website Faster](https://justidea.agency/_astro/szablon-7-17-1-6fc7e17d.B0IrnxQI.webp)  Web Development

Trusted by

 ![LPP](https://justidea.agency/obrazy/lpp-logo-2-b64d3a02.svg)  ![House](https://justidea.agency/obrazy/logo-house-c706eeae.svg)  ![Toyota](https://justidea.agency/obrazy/toyota2-1-63c6570a.webp)  ![Fame MMA](https://justidea.agency/obrazy/fame-ffb4e0d0.webp)  ![Surf Inc.](https://justidea.agency/obrazy/surfinc-91e5b73d.webp)  ![LyoFood](https://justidea.agency/obrazy/lyo-cb899d46.webp)  ![ExpertSender](https://justidea.agency/obrazy/expert-ca00548d.webp)  ![Purinova](https://justidea.agency/obrazy/purinova-217da6ab.webp)  ![Mennica Gdańska](https://justidea.agency/obrazy/mennica-98166c12.webp)  ![Group IB](https://justidea.agency/obrazy/group-ib-b711171e.webp)  ![Smart Kids Planet](https://justidea.agency/obrazy/smart-kids-151311c5.webp)  ![SuperSonic](https://justidea.agency/obrazy/supersonic-a35404fe.webp)  ![Wierzynek](https://justidea.agency/obrazy/wierzynek-1-d027e7cc.webp)  ![RegoBis](https://justidea.agency/obrazy/regobis-a8b446e3.webp)

**In this article**

1. 01Page load speed: how to make your website faster
2. 02Why is load speed important?
3. 03How to measure website speed: measurement tools
4. 04Google PageSpeed Insights: how it works and what it measures
5. 05GTmetrix: a detailed analysis of page performance
6. 06Pingdom Website Speed Test: real-time performance monitoring
7. 07Lighthouse: a comprehensive analysis of page quality
8. 08Google Analytics 4 and load speed
9. 09What affects page load speed? Key factors
10. 10Image optimisation: format, size and compression
11. 11Lazy loading: delayed loading of resources
12. 12Video on the page
13. 13Using browser caching
14. 14Minification and code optimisation: JS, CSS, HTML
15. 15Redirect chains
16. 16Eliminating render-blocking resources
17. 17Asynchronous file loading
18. 18Hosting and the server's role in site load speed
19. 19Gzip compression: faster data transfer between server and browser
20. 20PHP version and page load speed
21. 21The HTTP/3 protocol
22. 22What is TTFB, and why does it affect page speed?
23. 23Cloudflare CDN: site speed and security
24. 24Summary: how to improve page load speed
25. 25Frequently asked questions about page load speed
26. 26Also check out:

Share

Every second counts. Mobile users abandon slow-loading pages within a few seconds, and website load speed today isn't just a matter of comfort: it's one of Google's official ranking factors, directly tied to Core Web Vitals. Improving Core Web Vitals usually requires the technical team to work with marketing, and a [marketing agency](https://justidea.agency/en/services/digital-marketing-agency/) is what ties the two together.

Whether you're just starting to check your site's speed with tools like Google PageSpeed Insights or Lighthouse, or you're after more advanced optimisation methods, you'll find practical tips here suited to different levels of technical knowledge.

## Page load speed: how to make your website faster

In today's fast-changing online world, **page load speed** is a key element that can decide the success or failure of your online presence. Users expect pages to load almost instantly.

In this article we'll focus on how to **speed up your website**, not just to satisfy users but also to improve its position in search results. We'll dig into the techniques and tools that will help you **optimise load speed**, from simple changes you can make yourself to more advanced methods that require specialist knowledge. Whether you're a developer or a less technical person, you'll find valuable tips here to help make your site faster and more competitive.

## Why is load speed important?

A slow-loading page isn't just user frustration, it's a real loss. Since 2021, Google has included [Core Web Vitals](https://justidea.agency/en/services/websites/website-speed-optimization/) as a ranking factor, which means page load speed directly affects search rankings. The longer a user waits, the greater the chance they'll go back to Google and click a competitor's result.

Load speed optimisation covers both simple changes that don't require technical knowledge, such as compressing images or enabling caching, and more advanced methods that require changes to the server, code or hosting configuration. In this article you'll find practical tips for both groups.

## How to measure website speed: measurement tools

To understand how to **speed up your website**, you first need to know exactly what challenge you're dealing with. There are several tools you can use to measure **your page's load speed**, giving you valuable pointers on which areas need optimising. **Here are some of the most popular tools that will help with this analysis:**

- **Google PageSpeed Insights**: a free tool from Google that assesses page load speed on both mobile and desktop devices. It also provides recommendations on how to improve your results.
- **GTmetrix**: offers a detailed analysis of page load speed, showing key performance indicators and suggestions for improvements.
- **Pingdom Website Speed Test**: a tool that gives you insight into page load time and a performance assessment, along with specific optimisation recommendations.

**Using these tools, you can quickly diagnose performance problems** and identify the first steps towards speeding up your website. Remember that even small improvements can significantly affect user experience and your position in search results.

## Google PageSpeed Insights: how it works and what it measures
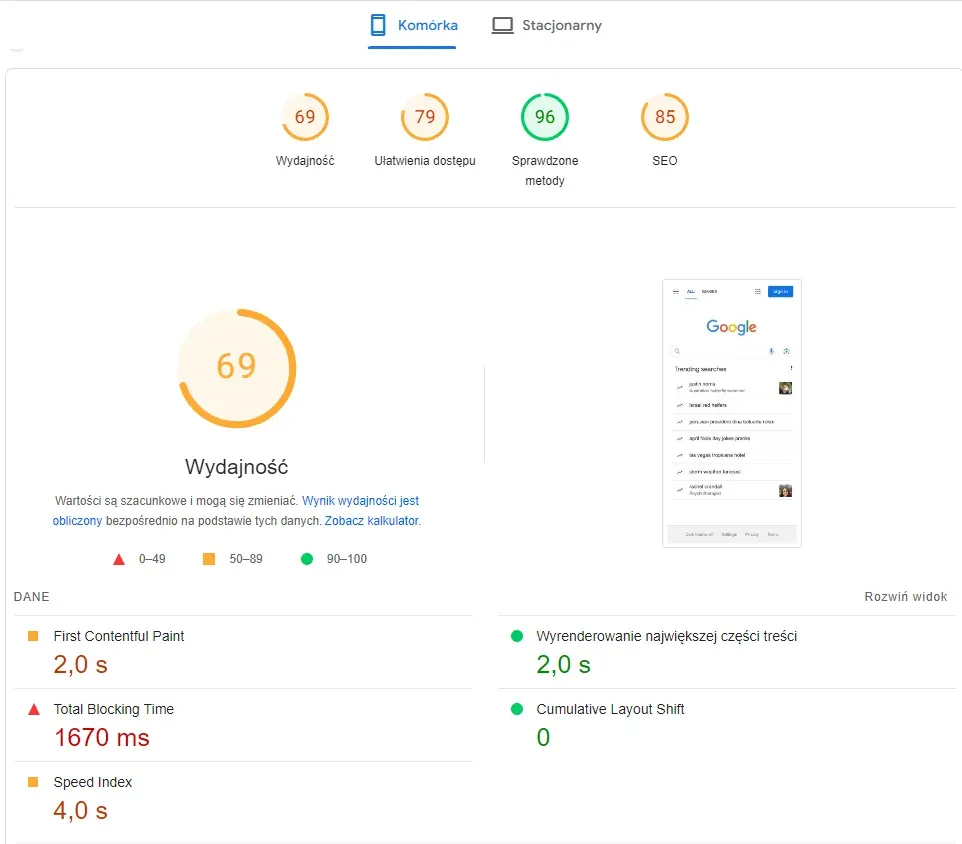
 ![Google PageSpeed Insights and page speed](https://justidea.agency/_astro/page-speed-insights-b25f1d47.Df7fPQ13_26c8NF.webp)

Google PageSpeed Insights and page speed

[Google PageSpeed Insights (PSI)](https://justidea.agency/en/services/websites/website-speed-optimization/) is one of the most valued tools among webmasters and SEO specialists. It analyses a page's content and generates specific recommendations for improving load speed on both mobile and desktop devices.

After you enter a URL, the tool assesses the page's performance along two dimensions. The first is performance optimisation: the assessment is based on [Core Web Vitals](https://justidea.agency/en/services/websites/website-speed-optimization/) metrics: [Largest Contentful Paint (LCP)](https://justidea.agency/en/services/websites/website-speed-optimization/), [Interaction to Next Paint (INP)](https://justidea.agency/en/services/websites/website-speed-optimization/) and [Cumulative Layout Shift (CLS)](https://justidea.agency/en/services/websites/website-speed-optimization/). The second is optimisation recommendations: a list of specific changes to implement, including reducing server response time, removing render-blocking resources and optimising images.

Regularly monitoring your PageSpeed Insights results lets you track optimisation progress and react quickly to regressions before they affect your search rankings.

## GTmetrix: a detailed analysis of page performance
 ![GTmetrix and website loading](https://justidea.agency/_astro/gtmetrix-1024x359-7fcd4ce8.C7hNwHf2_Z3ebNv.webp)

GTmetrix and website loading

GTmetrix is an advanced website performance analysis tool that combines performance tests with specific optimisation recommendations. It analyses pages using metrics such as [Time to First Byte (TTFB)](https://justidea.agency/en/services/websites/website-speed-optimization/), Fully Loaded Time and Total Page Size, giving you a detailed picture of what's slowing your site down.

One of GTmetrix's standout features is its test history: the ability to track performance changes over time, which lets you assess the real impact of each optimisation you make. The tool also lets you test a page from different locations around the world, which matters for sites with an international reach. Every report points to specific elements to improve, along with their priority and estimated time savings.

## Pingdom Website Speed Test: real-time performance monitoring

 ![Pingdom Website Speed Test and load speed](https://justidea.agency/_astro/pingdom-website-speed-test-2-1024x599-5139bf42.l-Dhgy3c_Z2lhGV3.webp)

Pingdom Website Speed Test and load speed

Pingdom Website Speed Test is a popular tool for analysing and monitoring website performance, valued for its clear interface and wide range of features. It analyses pages for load time, resource size and the number of HTTP requests, identifying the elements slowing your site down the most.

Every analysis ends with a performance score compared against benchmarks, so you can immediately see how your page stacks up against others. The tool points to specific components to improve and provides practical recommendations, without requiring advanced technical knowledge. This makes Pingdom useful for beginners and experienced SEO specialists alike.

One of Pingdom's standout features is the ability to continuously monitor your site in real time. The tool can automatically alert you to performance drops or site downtime, which is especially useful for high-traffic sites, where every minute of downtime has a real cost.

## Lighthouse: a comprehensive analysis of page quality

 ![Page load speed: Google Lighthouse](https://justidea.agency/_astro/lighthouse-bfc27cb9.BclebEst_Z1G2gDo.webp)

Page load speed: Google Lighthouse

Lighthouse is an open-source tool from Google for analysing website quality, valued for its comprehensive approach that goes beyond performance alone. The report covers five categories: performance, accessibility, best practices, SEO and Progressive Web App. Each one gets a score from 0 to 100, letting you quickly see which areas need attention.

You can run the analysis directly in Chrome DevTools (the Lighthouse tab), through PageSpeed Insights or from the command line, which is useful for automating tests in CI/CD environments. The result isn't just a number, but a detailed list of specific issues, explaining why a given element is slowing down the page and how to fix it.

In practice, Lighthouse is a starting point for optimisation: the performance section points to render-blocking resources, uncompressed images or JavaScript files that are too large. The SEO section checks basic technical elements such as meta descriptions, heading tags and indexability. Running tests regularly after every major site change lets you catch regressions before they affect your actual search results.

## Google Analytics 4 and load speed

 ![Google Analytics 4 logo](https://justidea.agency/_astro/logo-google-analytics-1920x1080-1024x576-d4dc8f6f.B8Ciuw3M_Z1WqVHo.webp)

Google Analytics 4 logo

Google Analytics 4 isn't a tool for measuring page speed (that's what PageSpeed Insights or GTmetrix are for), but it provides something those tools don't: data on how load speed translates into real user behaviour.

GA4 automatically records performance-related events, including INP (Interaction to Next Paint), a Core Web Vitals metric that measures a page's responsiveness to user interactions. This lets you correlate technical results with business data: do pages with a higher INP have a higher bounce rate? Do slower pages convert worse? These are questions GA4 lets you answer in the context of your specific site and its users.

Custom reports focused on load speed provide practical value: you can compare load time against conversions, revenue or engagement across different sections of your site. This translates technical optimisation into the language of business results, which makes it easier to prioritise actions and justify investment in performance.

## What affects page load speed? Key factors

Page load speed is affected by several layers at once: resources, code, the server and connection architecture. Optimising images and JS/CSS files usually has the biggest impact: large, uncompressed files are the most common cause of slow loading. The number of HTTP requests matters just as much: every element on the page requires a separate request to the server, which is why combining files and [lazy loading](https://justidea.agency/en/services/websites/website-speed-optimization/) matter so much.

On the server side, what matters most is hosting quality, the server's location relative to the user and implementing a CDN, which delivers resources from the geographically nearest node. Server response time (TTFB) also depends on the PHP version, cache configuration and protocol: HTTP/3 shortens connection setup time compared to older versions.

External scripts are a separate category: ads, analytics tools and plugins loaded synchronously can block page rendering regardless of how well-optimised the site's own resources are. On dynamic sites, there's also database performance to consider: poorly optimised queries slow down page generation before anything even reaches the browser.

## Image optimisation: format, size and compression

Optimising images on a website is a key element of improving load speed. Properly managing the format, size and compression of photos can significantly cut load time without sacrificing visual quality. Here are a few tips for managing images effectively.

**Choosing the right format:**

- **JPEG**: Ideal for photos and images with lots of colour. JPEG allows for significant compression, reducing file size while keeping acceptable quality.
- **PNG**: Better for images with transparency and graphics where sharp edges matter. PNG offers better quality at a larger file size compared to JPEG.
- **WebP**: A modern format offering excellent compression while keeping high image quality. WebP is supported by most modern browsers and can be used for both graphics and photos.
- **SVG**: Excellent for icons and other vector graphics. SVG is an XML-based format, meaning it scales perfectly across different resolutions and sizes, with a minimal file size.
- **AVIF**: The newest image compression format, offering even better compression than WebP while keeping high quality. Supported by all major browsers since 2024. Especially effective for product photos: file size can be 30-50% smaller than with WebP.

### How to optimise graphics

Image compression falls into two types. Lossless compression reduces file size without any loss of quality, and is preferred wherever every detail matters. Lossy compression shrinks the file size significantly at the cost of minor detail, which for product photos is usually imperceptible to the eye. Tools such as TinyPNG or JPEGmini automate this process effectively. It's also important to match image dimensions to the actual display size on the page: placing photos at a higher resolution than needed just unnecessarily adds to load time.

## Lazy loading: delayed loading of resources

Lazy loading is an optimisation technique that delays loading resources, such as images, videos or content blocks, that aren't needed straight away on the page's first load. Instead of downloading everything at once, the browser only loads a given element once the user scrolls close to where it's going to appear.

In practice, on the page's first load, all resources outside the initial viewport are skipped. A script tracks scrolling and dynamically loads further elements just before they become visible. The technique can be applied to images, videos, iframes and other resources that aren't critical for rendering the first screen.

The benefits are noticeable on both the user's and the server's side. A shorter initial load time directly improves your LCP score in Core Web Vitals, which matters for rankings. The server handles fewer simultaneous requests, and mobile users, especially on slower connections or limited data plans, only download the resources they actually see on screen.

### How to implement lazy loading

The simplest method is the native loading="lazy" attribute on the <img> or <iframe> tag: all modern browsers support it without needing extra scripts. For older browsers or more complex scenarios, JavaScript libraries such as LazySizes are available. It's worth remembering not to apply lazy loading to images visible without scrolling: delaying their loading will worsen LCP instead of improving it. Above-the-fold images should load immediately, with the fetchpriority="high" attribute.

## Video on the page

Adding video to a website can significantly enrich the user experience, but without proper optimisation it has a negative impact on load speed and overall site performance.

The simplest way to avoid overloading your server is to host video on external platforms such as YouTube or Vimeo. Video streamed from external, optimised sources doesn't load your server, and embedding it on the page just means pasting in a short snippet of code. If you do decide on self-hosting, though, choose the modern MP4 format with the H.264 codec: it offers good compression while keeping high quality. It's also worth considering serving lower quality to mobile users, for whom speed matters most.

Just like with images, video should use the lazy loading technique: the file only loads once the user scrolls to where the video appears. This significantly improves the load time of the whole page, especially when the video is placed further down the content. It's worth setting the preload attribute on the <video> tag to none or metadata: fully preloading a video before it's even played unnecessarily slows down the page.

It's also good practice to show a static placeholder image with a play button instead of automatically loading the player. The user decides for themselves when to start the video, and the page loads faster. Also remember [responsiveness](https://justidea.agency/en/services/websites/website-speed-optimization/): video should display correctly on every device and screen resolution.

## Using browser caching

Browser caching is one of the most effective techniques for optimising page performance. It involves storing static resources, such as CSS files, JavaScript and images, directly in the user's browser, so that on subsequent visits these elements load locally, without being downloaded again from the server.

When a user visits a page for the first time, the browser downloads all the necessary resources and saves them in the cache. On the next visit, whether to the same page or another one using the same stylesheets or scripts, loading happens from local memory, which significantly cuts load time. The effect is especially noticeable for returning users and translates into lower server load and reduced bandwidth use.

### How to configure caching

The key tool is the Cache-Control header, which specifies how long resources should be stored in the cache, for example max-age=31536000 means storing them for a year. This is complemented by the Expires header, which points to a specific expiry date for the resource. Resources that rarely change, such as fonts, logos and JS libraries, are ideal candidates for long caching. Dynamic and personalised content, on the other hand, should be excluded from caching to avoid showing outdated data. When updating CSS or JS files, it's worth renaming them or adding a version parameter to the URL: this forces the browser to download the fresh version instead of using an outdated cached copy.

## Minification and code optimisation: JS, CSS, HTML

Reducing and optimising code on a website is essential work that contributes to better performance, faster load times and greater accessibility. **Here are a few key strategies:**

### 1. Minimising the amount of code

The first step is reviewing the code for elements that can be removed: unused functions, redundant variables, dead CSS styles and JavaScript that's no longer called. Tools such as tree shaking for JavaScript and dedicated CSS-cleaning tools can automatically detect and remove unused code. Simple rule: the less code the browser has to download and process, the faster the load.

### 2. Minifying JS, CSS and HTML files

**Minifying JavaScript (JS), CSS and HTML files** is a key optimisation technique aimed at reducing file size by removing unnecessary characters, such as whitespace, comments and unneeded line breaks, without changing the code's functionality. This process significantly speeds up a website's load time, improving both user experience and search rankings. Here's some key information about minification:

- **JavaScript (JS)**: JS minification reduces file size by removing unnecessary characters, shortening variable names to single-letter identifiers where possible, and combining multiple files into one, which reduces the number of HTTP requests.
- **CSS**: For stylesheets, minification removes all whitespace, comments and unnecessary separators, allowing the browser to process styles faster.
- **HTML**: HTML minification works similarly, removing unnecessary whitespace and comments, which can be especially helpful in large HTML files.

**Implementing minification** as part of your website optimisation process is an effective way to improve performance and usability, with a direct impact on user experience and the site's online visibility.

### 3. Optimising CSS and JavaScript

Critical CSS, meaning the minimal set of styles needed to render the above-the-fold part of the page, is worth inlining directly in the <head> section. This lets the browser render the first screen immediately, without waiting to download external stylesheets. JavaScript that isn't essential for the first load should be loaded with the async or defer attribute: this eliminates render blocking and speeds up the time to interactivity (INP).

### 4. Using modern technologies

Modern JavaScript frameworks and libraries are usually well optimised for performance and use proven design patterns. Web Components let you create reusable, isolated components that don't interfere with the rest of the page, which benefits both performance and code maintainability.

### 5. Performance analysis and profiling

The developer tools built into Chrome and Firefox let you carry out detailed performance analysis: identifying bottlenecks, viewing the execution time of individual scripts and monitoring how the changes you make affect load time. Running regular Lighthouse tests gives you a structured overview of your page's condition and a specific list of improvements to implement.

## Redirect chains

Multiple redirects, also known as redirect chains, can significantly affect page load speed and the overall user experience. When a browser tries to access a page, every redirect adds extra waiting time, because the server has to process each request in turn. Here's how to manage redirects to minimise their impact:

- **Minimise the number of redirects**: Try to limit the use of redirects to an absolute minimum. Where possible, replace redirect chains with a single direct redirect to the final destination.
- **Use 301 redirects instead of 302s**: [301 redirects](https://justidea.agency/en/services/websites/website-seo-audit/) (permanent redirects) are preferred for SEO over 302 redirects (temporary redirects), because they pass on more link value. Browsers can also cache 301 redirects, which can reduce load time on subsequent visits.
- **Optimise redirects for mobile devices**: Avoid separate redirects for mobile devices by using responsive design that automatically adapts to the device's screen size.
- **Check your server configuration**: Make sure your server configuration is optimal and doesn't generate unnecessary redirects, especially when accessing the root directory or using HTTPS.
- **Use redirect analysis tools**: Tools such as Httpstatus.io or Screaming Frog SEO Spider can help you identify and remove unnecessary redirect chains.

## Eliminating render-blocking resources

Eliminating render-blocking resources is a key practice in optimising website load speed. Resources such as CSS and JavaScript can delay content from displaying on the page when loaded in the traditional way. Here are a few ways to manage these resources to improve page performance:

1. **Optimising CSS: critical CSS**: Critical CSS is the minimal set of styles needed to render the visible part of the page (above the fold). It should be delivered inside the page's <head> tag, so the content renders quickly while the remaining styles load asynchronously.

**Asynchronously loading non-critical CSS**: Use the media attribute or JavaScript to load the remaining stylesheets asynchronously, which allows the critical part of the page to render faster.

2. **Optimising JavaScript: asynchronous loading**: Scripts that aren't critical for the page's initial render can be loaded asynchronously using the async or defer attribute on the <script> tag. This lets the page loading process continue without waiting for the script to be downloaded and run. **Minimising and minifying**: Just as with CSS, JavaScript should be trimmed down to its critical minimum and minified to reduce its size and load time.

3. **Using browser caching**: For static resources such as CSS and JavaScript, set appropriate caching headers so browsers can store these files locally. This means that on subsequent visits, loading these resources can be skipped entirely, speeding up page load time.

4. **Removing unused CSS and JavaScript**: Tools such as PurifyCSS, UnCSS or tree shaking for JavaScript can help you identify and remove code that isn't being used, which reduces resource size and speeds up load time.

5. **Using a CDN**: Consider using a content delivery network (CDN) for static resources. A CDN can reduce resource load time by serving files from a location closer to the user.

6. **Testing and analysis**: Regularly test your page's performance using tools such as Google PageSpeed Insights, Lighthouse or WebPageTest to identify and remove render-blocking resources.

## Asynchronous file loading

Asynchronous file loading is an optimisation technique that lets a page and its resources, such as JavaScript scripts or CSS stylesheets, load at the same time without blocking page rendering. This means the user can see and interact with the page faster, even if not all resources have finished loading yet. Here's the key information about asynchronous loading:

### Asynchronous JavaScript loading

Two attributes are available. async makes the script download in parallel with HTML parsing and run immediately once it's downloaded, regardless of its order in the document. It works well for scripts that don't depend on others and don't modify the DOM while the page loads:

<script async src="path/to/script.js"></script>

defer also loads the script asynchronously, but guarantees it only runs after the HTML document has fully loaded, and preserves the order of scripts. It's the right choice for scripts that depend on the full DOM or on other scripts:

<script defer src="path/to/script.js"></script>

### Asynchronous CSS loading

CSS stylesheets can be loaded asynchronously via JavaScript: dynamically adding a <link> tag to the document means the styles download without blocking rendering, which is especially useful for non-critical stylesheets:

var link = document.createElement('link'); link.rel = 'stylesheet'; link.href = 'path/to/file.css'; document.head.appendChild(link);

An alternative is to use the media attribute on the <link> tag, which limits the stylesheet's loading to situations where a specific condition is met, for example printing or a particular screen width:

<link rel="stylesheet" href="print.css" media="print">

## Hosting and the server's role in site load speed

Improving a website's load speed often requires action not just at the level of code and content optimisation, but also on the hosting server side. Here are a few key elements worth considering to improve hosting performance and speed up your site:

### Choosing the right hosting

The type of hosting has a direct impact on performance. Shared hosting works fine for low traffic, but for sites with more visitors, a VPS or dedicated server offers better stability and speed. Server location also matters: the closer it is geographically to your target audience, the shorter the response time and the faster the page loads.

### CDN: delivering content from the nearest server

A CDN (Content Delivery Network) stores a copy of a site's resources on multiple servers spread out geographically. Content reaches the user from the nearest location, which reduces latency and significantly speeds up loading, especially for visitors from different parts of the world.

### Database optimisation

Regularly cleaning and optimising your database translates into faster queries and shorter load times. For sites built on WordPress or PrestaShop, it's worth removing old post revisions, unused data and redundant metadata that, over time, unnecessarily weigh down the database.

### Compression and caching at server level

Enabling Gzip or Brotli compression reduces the amount of data transferred over the network, which directly cuts load time. Server-side caching, for example using Varnish Cache, eliminates the need to repeatedly process the same requests and speeds up content delivery to the user.

### PHP version and server monitoring

Using the latest stable version of PHP and up-to-date server software (Apache, Nginx) translates into better performance and security. Regularly monitoring CPU, RAM and bandwidth usage lets you detect problems before they start to really affect how your site runs.

## Gzip compression: faster data transfer between server and browser

Gzip compression is a method for reducing the size of files sent from the server to the user's browser. It works on text files, HTML, CSS and JavaScript, eliminating redundant data and reducing the number of bits needed to represent the same information. When a browser requests a resource and signals that it supports Gzip, the server sends the compressed version of the file. The browser decompresses it on receipt, and the user notices no difference at all, except that the page appears faster.

The results are measurable: smaller files cut load time, reduce bandwidth use and translate into better Core Web Vitals scores, which matters for rankings.

### How to implement Gzip

Implementation depends on your server. On **Apache**, it's enough to add the mod\_deflate module configuration to the .htaccess file:

<IfModule mod\_deflate.c> AddOutputFilterByType DEFLATE text/plain text/html text/css application/javascript application/json </IfModule>

On **Nginx**, compression is enabled in the nginx.conf file:

gzip on; gzip\_types text/plain text/css application/json application/javascript text/xml application/xml text/javascript;

On **IIS**, Gzip compression is configured in IIS Manager, in the "Compression" section.

### Gzip vs Brotli: which to choose in 2026?

It's also worth considering Brotli, a newer compression algorithm developed by Google that achieves a better compression ratio than Gzip, especially for HTML and CSS files. Brotli is supported by all modern browsers and available on Apache, Nginx and Cloudflare. If your server allows it, Brotli should be your first choice, with Gzip remaining a good fallback for older clients.

## PHP version and page load speed

Updating to the latest version of PHP is one of the easiest and most effective ways to increase your website's speed and security. PHP is a server-side scripting language widely used in building websites. Every new PHP version brings performance improvements, new features and security fixes, which makes updating a key part of site maintenance.

### Why does updating PHP matter?

- **Improved performance**: Newer PHP versions, such as PHP 8.x (8.3/8.4), significantly outperform older versions in execution speed. You can notice a considerable difference in page load time and server response after updating.
- **Increased security**: Every update brings security patches that protect against newly discovered vulnerabilities. Keeping PHP up to date is critical to avoid known flaws being exploited by attackers.
- **New features**: New PHP versions introduce new features and capabilities that can make site development easier and faster, allowing you to implement more modern and efficient solutions.
- **Community support**: Older PHP versions are gradually withdrawn from official support, meaning they'll no longer receive security updates or bug fixes. Keeping PHP up to date gives you access to community and developer support.

### How to update PHP

The PHP update process varies depending on your hosting and server configuration. Here are the general steps to take:

- **Check compatibility**: Before updating, check that your site, including all plugins and themes, is compatible with the new PHP version.
- **Backup**: Always make a full backup of your website and database before updating.
- **Update on the server**: The update process varies depending on your hosting environment. Many hosting services let you change the PHP version directly from the hosting admin panel. For self-managed servers, the update can be carried out using the operating system's package manager.
- **Testing after the update**: After updating PHP, thoroughly test your site to make sure everything functions correctly.

Updating PHP can be one of the simplest ways to significantly increase your website's performance and security. Always remember to regularly check for new versions and keep your software up to date.

## The HTTP/3 protocol

HTTP/3 is the latest version of the HTTP protocol and the biggest change in network data transfer architecture in years. Earlier versions, HTTP/1.1 and HTTP/2, were based on the TCP protocol, which, despite successive improvements, had one fundamental limitation: head-of-line blocking. When one data packet is lost in transit, the whole queue waits for it to be resent, even if the remaining resources are ready.

HTTP/3 solves this problem at its root by replacing TCP with **QUIC**, a protocol based on UDP. Each data stream is independent: losing one packet doesn't block the others. The effect is especially noticeable on unstable mobile connections, where packets get lost more often: the page loads more smoothly, without the characteristic "stutters".

The key improvements in HTTP/3 compared to earlier versions are, above all, faster connection setup: the QUIC protocol combines the transport and cryptographic handshake into a single operation (instead of two in **HTTP/2**), which shortens the time to first byte (TTFB). Encryption is built in here and mandatory, not optional. Connection migration is another new feature: when a user switches from Wi-Fi to mobile data, the session isn't interrupted but smoothly carried over to the new connection. HTTP/3 also keeps all the advantages of HTTP/2: multiplexing, header compression and request prioritisation.

### How to implement HTTP/3

Cloudflare, Google and most major CDNs support HTTP/3 by default: if you're using Cloudflare, the protocol is probably already active. For your own server, Nginx has supported HTTP/3 since version 1.25, and Apache through the mod\_quic module. An SSL/TLS certificate is required, since HTTP/3 only works over an encrypted connection. You can verify support with the HTTP/3 Check tool or in the Network tab of Chrome's DevTools (the Protocol column: a value of "h3" means HTTP/3 is active).

Implementing HTTP/3 translates into a shorter TTFB, better Core Web Vitals scores and noticeably smoother page loading on mobile devices, all without any changes to the site's code.

## What is TTFB, and why does it affect page speed?

TTFB (Time to First Byte) is the time that passes from the moment the browser sends a request to the server until it receives the first byte of the response. The lower the TTFB, the faster the page starts loading: the user doesn't have to wait for the server to respond, and Google sees the page as responsive.

Several factors affect TTFB: how long the server takes to process the request, network latency resulting from the distance between the user and the server, hosting load and the speed of database queries for dynamic sites. Even a well-optimised page can have a high TTFB if the server or hosting itself can't keep up with the traffic.

Google recommends that TTFB shouldn't exceed 800 ms. Values above this threshold can negatively affect your Core Web Vitals score, specifically LCP.

### How to improve TTFB: practical ways to get a faster server

The most important step is implementing server-level caching: serving ready-made pages instead of generating them for every request can cut response time several times over. For sites serving users from different locations, implementing a CDN is also key, delivering content from the node closest to the visitor and eliminating geographic latency.

If your site runs on shared hosting, it's worth considering migrating to a VPS or dedicated server: this is one of the most common causes of high TTFB, especially under heavier traffic. At the same time, you should optimise your database: indexing tables, reducing unnecessary queries and implementing query caching (for example with Redis or Memcached) clearly speeds up the generation of dynamic pages.

## Cloudflare CDN: site speed and security

[Cloudflare](https://justidea.agency/en/blog/cloudflare-step-by-step-guide/) is one of the most recognisable Content Delivery Network (CDN) services, and it also offers a wide range of features related to security and website performance optimisation. A CDN is a network of distributed servers that deliver a website's content to users based on their geographic location, which increases page load speed and improves the overall user experience.

### Key Cloudflare features:

- **A distributed content delivery network**: Cloudflare has servers located all over the world, allowing content to be delivered quickly to users regardless of their location, by storing copies of a site's resources (such as images, CSS and JavaScript files) on CDN servers.
- **Performance optimisation**: Cloudflare automatically optimises website file sizes (for example through compression), which further speeds up loading. The service also supports modern protocols such as HTTP/2 and HTTP/3, providing even faster connections.
- **Security and DDoS protection**: Cloudflare offers advanced security solutions, including DDoS attack protection, secure SSL connections, a web application firewall (WAF) and features that guard against data scraping and other threats.
- **Ease of configuration and management**: Thanks to its user-friendly interface, configuring and managing Cloudflare's services is simple. You can quickly enable or disable individual features, adjust protection settings and monitor traffic and threats.
- **A free plan and flexible payment options**: Cloudflare offers a basic plan that's free and provides basic protection and optimisation for websites. For more demanding users, paid plans are available, offering additional features and greater configuration options.

**Integrating with Cloudflare** usually requires changing your domain's name servers (DNS) to Cloudflare's servers. This process is well documented and supported by interactive instructions in the Cloudflare management panel. Once the DNS is changed, traffic to and from the site is routed through Cloudflare's network, enabling performance optimisation and security.

## Summary: how to improve page load speed

Page load speed affects user experience, search rankings and business results all at once. Optimisation starts with resources: compressing and converting images to WebP or AVIF, implementing lazy loading, and minifying CSS, JS and HTML files are changes that deliver an immediate effect. The server layer matters just as much: browser caching, Gzip or Brotli compression, an up-to-date PHP version and the HTTP/3 protocol shorten server response time and reduce TTFB. A CDN means content reaches the user from the geographically nearest server, and limiting redirect chains eliminates unnecessary delays.

Performance optimisation is an ongoing process: running regular tests in PageSpeed Insights and monitoring Core Web Vitals lets you catch regressions before they affect your Google rankings. If you want to speed up your site or online store, get in touch with us.

## Frequently asked questions about page load speed

### How do I check my website's speed?

The simplest way is Google PageSpeed Insights: you enter a URL and get a score along with a list of issues to fix. For a more thorough speed measurement, it's worth using GTmetrix or Lighthouse (built into Chrome DevTools), which show Core Web Vitals: LCP, CLS and INP.

### What counts as a good PageSpeed Insights score?

A score above 90 is considered good, 50-89 needs improvement, and below 50 is poor. Keep in mind, though, that the PageSpeed score is a technical indicator, not a direct ranking factor: Google looks at real-world data from the Chrome User Experience Report (CrUX), not just the tool's score.

### What's the optimal page load time?

Google recommends that LCP (Largest Contentful Paint) stays below 2.5 seconds. For total page load time, under 3 seconds is generally considered a good result: above that threshold, the bounce rate rises, especially on mobile devices.

### Does page load speed affect search rankings?

Yes: Core Web Vitals have been an official Google ranking factor since 2021. A slow page with a high LCP or high CLS can lose position against competitors, even if the content is high quality. Speed is one element of Page Experience.

### Can I improve site speed without a developer?

For WordPress, yes, to a large extent. Cache plugins (such as WP Rocket or LiteSpeed Cache), image compression and enabling lazy loading are changes you can make without knowing any code. More advanced optimisations, such as eliminating render-blocking resources, configuring the server or implementing HTTP/3, do require technical knowledge or a specialist to handle them.

### How do I measure page load speed over time?

It's worth setting up regular tests in GTmetrix (using its test history) or using Google Search Console, where the "Core Web Vitals" tab shows real user data broken down by mobile and desktop. Google Analytics 4, meanwhile, lets you analyse how page load time affects user behaviour and conversion.

## Also check out:

- [The FAQ section and its role in AI SEO: optimising for AI citations](https://justidea.agency/en/blog/faq-section-seo-ai-citations/)
- [How to effectively increase your CTR: practical tips](https://justidea.agency/en/blog/how-to-increase-ctr-in-seo/)
- [Does internal linking matter?](https://justidea.agency/en/blog/internal-linking-seo-guide/)
- [What is on-page SEO?](https://justidea.agency/en/blog/what-is-on-page-seo/)

 ![Wojciech Wabno](https://justidea.agency/obrazy/wojtek-240x300-42c3ca11.webp)

 Written by

[Wojciech Wabno](https://justidea.agency/en/author/wojciech-wabno/)

SEO Specialist

Have a question about this article? Write to us.

Want this in your business

## Let's turn this knowledge into results in your store

30 minutes about your numbers. The call starts with someone from sales, and we bring in the channel specialist once we get into the details. The call is free of charge.

Book a call about your numbers [See how we build websites](https://justidea.agency/en/services/websites/)

Client reviews

## Ratings of the agency that runs this blog

Clients gave them after working with us, and you can read each one on the site where it was posted. They cover the work of the whole agency, not this one article.

 4.96 / 5

weighted average of 224 reviews across three platforms

[Read the reviews](https://justidea.agency/en/justidea-reviews/)

[![Google](https://justidea.agency/assets/logo-google.svg)

 4.97 / 5

156 reviews on our Google Business Profile](https://www.google.com/search?q=JustIdea+Agency+Krak%C3%B3w+opinie)[![Facebook](https://justidea.agency/assets/logo-facebook.svg)

 5.0 / 5

33 reviews on our Facebook page](https://www.facebook.com/justidea.agency/reviews)[![Clutch](https://justidea.agency/assets/logo-clutch.svg)

 4.9 / 5

35 B2B reviews, each verified in a call with the client](https://clutch.co/profile/justidea-agency)

Statuses awarded by the platforms: PrestaShop Expert ★★★, Google Premier Partner 2025, Meta Business Partner, Microsoft Advertising Elite Partner 2025. [All certificates and awards](https://justidea.agency/en/our-awards/)

Read on

## See also

[Web Development 18 December 2023  How Much Does a WordPress Website Cost? A Complete Pricing Guide Paweł Pasterak](https://justidea.agency/en/blog/wordpress-website-cost-pricing-guide/)[SEO 25 April 2025  JavaScript SEO: A Practical Guide to Optimising Dynamic Pages Łukasz Zontek](https://justidea.agency/en/blog/javascript-seo-guide/)[SEO 21 April 2025  How to effectively rank a website in foreign markets? Łukasz Zontek](https://justidea.agency/en/blog/how-to-do-seo-for-foreign-markets/)

Contact

## A conversation about your numbers: 30 minutes

The call is led by a new business specialist. When we get into the details of an account, the specialist for that channel joins in. We reply within one business day.

A quick review of your tracking and campaignsThree priorities for the next quarterA written summary that stays with you

Before the meeting we review your website, your visibility and what your campaigns show from the outside. We will not open with “so, what does your company do?”.

[4.96 224 reviews](https://justidea.agency/en/justidea-reviews/)

What happens after you send it

01

within 1 business day

### We reply to your email

The reply comes from the same new business specialist who will run the call. No qualification form and no call from an unknown number.

02

this week

### A 30-minute conversation

We go through your numbers and your questions. If it turns out we are not the right fit, we will tell you straight away.