















The talk this article is based on. 27 minutes. Watch on YouTube →
For years, one magic word has circled around marketing: ROAS. Return on Ad Spend, the number that's supposed to tell you, in theory, whether your campaigns are working. In practice, though, it can be seriously misleading. When it comes time to look at the bottom line, the excitement disappears. Despite a "cosmic" ROAS, it turns out profit is standing still, or even falling. I often see ads where brands boast about a "15x ROAS" or a "1,200% return". On paper it looks impressive, but when you dig deeper, into the data, costs, margins, returns and discounts, it turns out that number has little to do with real growth.
That's exactly when the question comes up that I've heard many times: "If our campaigns have a 10x ROAS, why isn't the company making more money?"
And that's exactly what this article is about: why ROAS isn't a growth metric, how to actually read campaign results, and how Profit Analytics 1.0 helps you build a scalable, profitable e-commerce business.
High ROAS does not equal growth
In most cases, this simply means you're operating in a well-known, already-familiar market, among people who know you and react predictably. I like to explain this with the metaphor of two sacks.
The first is the users who are already with you. They come back, they buy, they react to your messages. This is where the best results come from, because the cost of reaching this group is low. The problem is that this sack has a bottom, and sooner or later it will run out.
The second sack is new customers. The people you still need to convince. They're more expensive, less predictable, but they're the ones who build real growth. The more you invest in that second sack, the more stable your business becomes, even if the numbers in your dashboard no longer look quite so impressive.

Over time, you also run into demand saturation: the longer you operate, the harder it is to reach further, equally well-matched audiences. Costs rise, and ROAS naturally falls. That's not a failure, it's a stage in a brand's maturing.
So instead of fighting for a "better ROAS", it's worth understanding where that result comes from and what context it has within a wider growth strategy. Because ROAS on its own, without reference to real profit and growth potential, is often just an illusion of efficiency.
How much should you really be spending on ads
From experience with hundreds of e-commerce businesses, I know one thing: most of them spend too little.
The average share of ad costs in revenue looks like this:
- E-commerce in general: 10-30%
- Fashion: 25-40%
- Electronics: 8-15%
- Beauty & cosmetics: 20-35%
- DTC: 20-50%
- Marketplaces and large stores: 5-15%
In other words: stop dreaming about double-digit ROAS. In today's market, with CPCs up 25% year on year, results like that simply mean you're not investing in growth. Growth takes courage and spending. The biggest players understand that.
Just look at the data from the Embedded Brand Strategy report:
- Gymshark: 56% of revenue on marketing,
- Warby Parker: as much as 124% of revenue in its early years (!),
- Temu and Shein: billions of dollars spent globally, hundreds of millions in Poland alone.
These aren't companies "chasing a ROAS of 10". These are brands that understand marketing is an investment, not a cost.
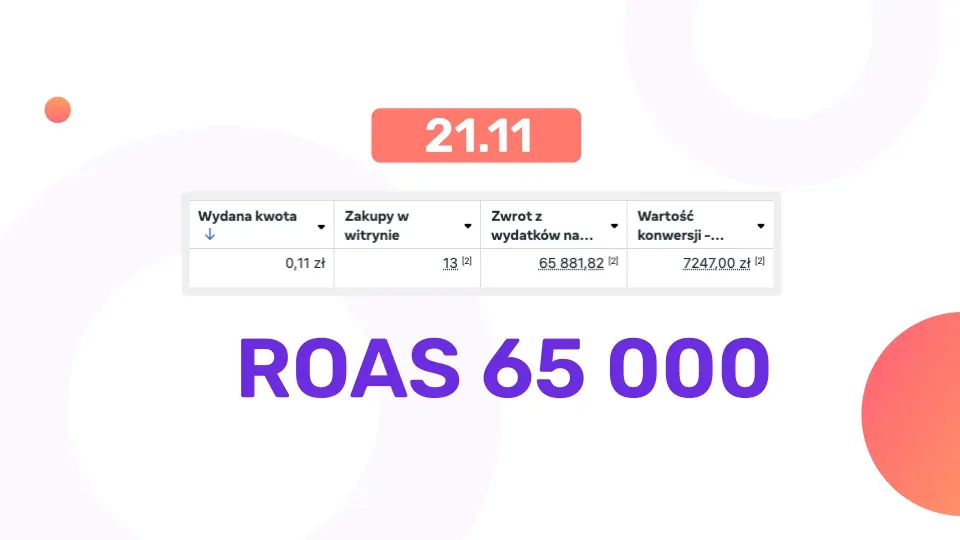
So where do these "magic" ads with a ROAS of 65,000 come from?
It's not a miracle. It's a data-context error. ROAS in ad platform dashboards (Google, Meta, and so on) can look spectacular for a few reasons:
- remarketing campaigns that reach customers who are already ready to buy,
- short date ranges (1 day, 2 days) that only show "the peak of the wave",
- no account taken of real costs, discounts, returns or transaction fees.
Let's look at an example with real data:
21 Nov → ROAS 65,000; 20-21 Nov → ROAS 10; 29 Nov → ROAS 429; 22-29 Nov → ROAS 16
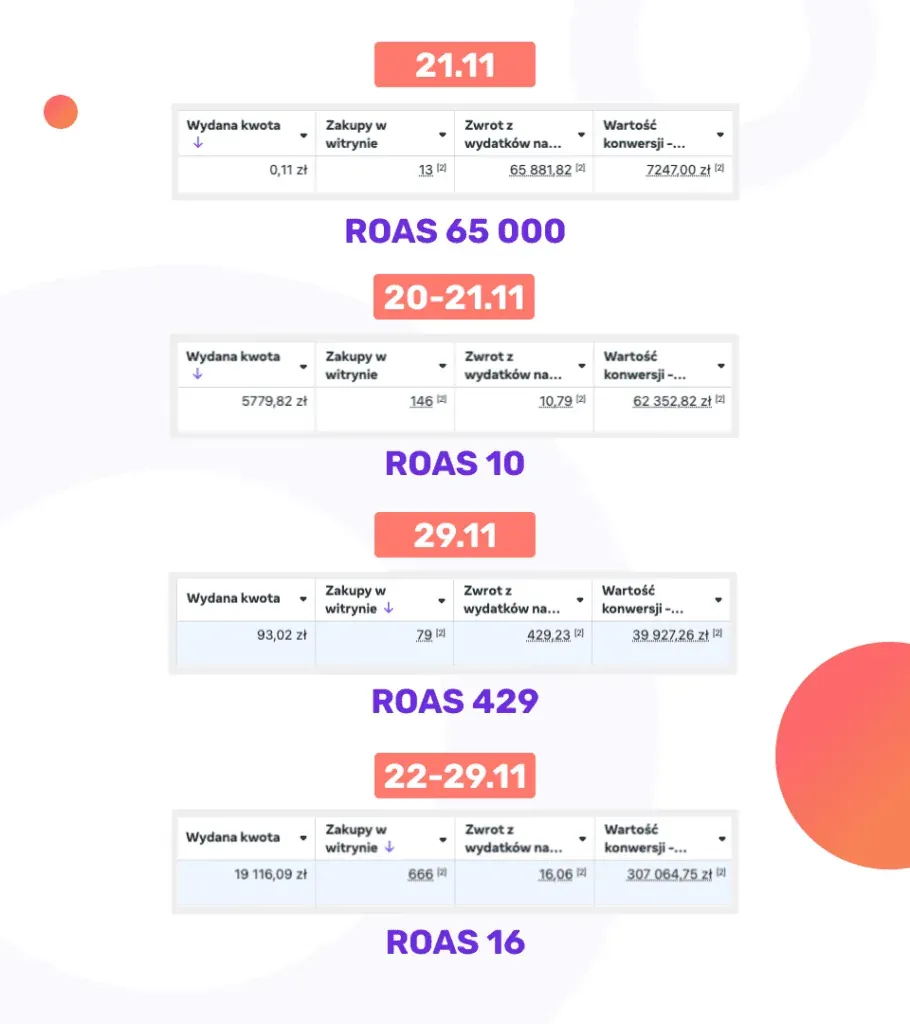
On paper, it looks like a marketing rollercoaster. But if you look closer, you'll see the differences come not from some miraculous effect of the ads, but from the date range and the way the numbers are calculated.
A one-day remarketing campaign on a small budget can show a ROAS of 65,000, but it won't contribute anything to the company's long-term growth.
Campaigns that acquire new customers, on the other hand, with a lower ROAS but wider reach, genuinely build future revenue.
And that's exactly where the real conversation about performance strategies begins.
The truth about performance marketing strategies
1. The ROAS strategy: outdated and misleading
This is still the most popular approach, but it's burdened with many flaws:
- over-attribution (the same conversion counted by both Google and Meta),
- modelling data based on impressions,
- limitations from ATT and GDPR.
No real information about profit.

There's no such thing as "a good ROAS of 4.2". Those numbers are meaningless without cost context.
2. The POAS strategy: real profitability
POAS (Profit on Ad Spend) is calculated like this: (Revenue minus all costs except advertising) divided by ad cost = POAS.
Interpretation:
- Above 100%: you're making a profit,
- = 100%: zero ROI (neutral),
- Below 100%: you're losing money or investing in future growth.

3. The MER strategy: a step in the right direction, but incomplete
MER (Marketing Efficiency Ratio) compares all revenue to all ad spend. It sounds good, but:
- it often lacks data on shared costs,
- the data is limited in time,
- implementation (Supermetrics + Make) is costly and complicated.
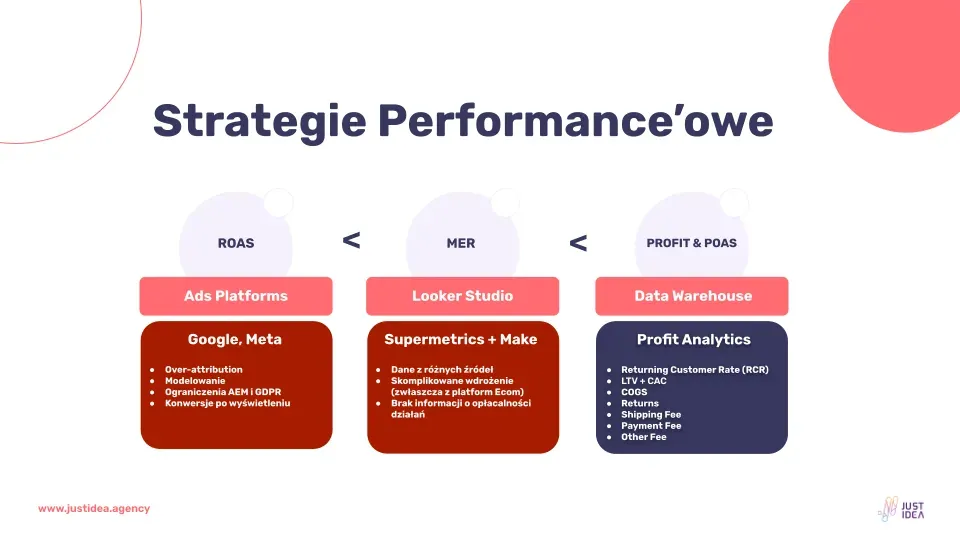
4. The profit strategy: Data Warehouse and Profit Analytics 1.0
This is where we get to the heart of it: full control over your data.
A Data Warehouse is a central data hub integrated with systems such as PrestaShop, Comarch, Baselinker, GA4, Meta Ads, Google Ads, and so on. With it, you can finally see real profit in real time.
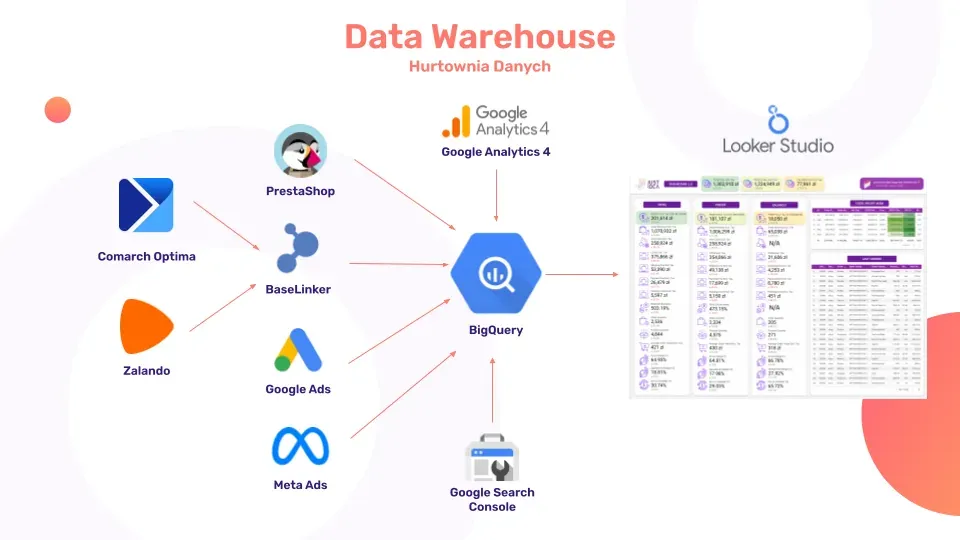
Unlike GA4, which is only a compass, a Data Warehouse is your business's GPS.
Projected Profit & POAS: our proprietary concept
At JustIdea, we developed a solution that lets you implement a profit-first approach in a single day, at 10-20x lower cost than a classic Data Warehouse. Projected Profit Analytics 1.0 lets you analyse:
- RCR (Returning Customer Rate),
- LTV + CAC,
- Projected COGS, returns, shipping fees, payment fees and other fees.
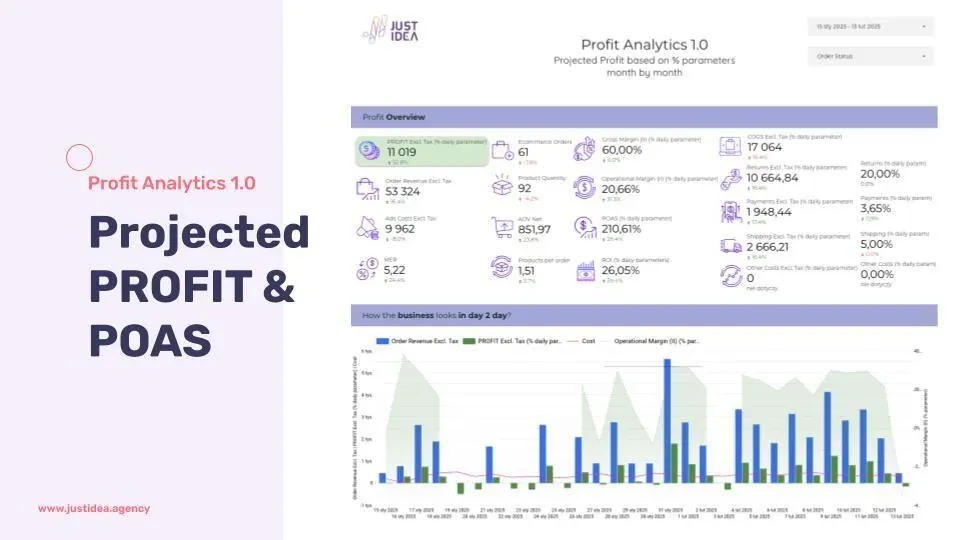
In practice, this means:
- you see profit per country,
- you can analyse the relationship between new and returning customers,
- you can measure the impact of changes in return costs, shipping or margin,
- you can simulate how each factor affects your profit.
This isn't theory, it's a solution we've implemented in our own e-commerce businesses.
Three growth strategies in e-commerce
Finally, the core of it. Every e-commerce business needs to define which growth strategy it's pursuing. There's no single right answer, only the one that's chosen consciously.
- Slower growth: a focus on margin, low risk, but slower development.
- Accelerated growth: investment in acquiring new customers, faster growth, but lower short-term profit.
- Balanced growth: a middle-ground strategy, closest to the reality of most brands.

It's like a tug of war: growth on one side, profitability on the other. The role of good analytics isn't to pick a side, it's to maintain the balance between them.
Summary
ROAS used to be a good metric, back in simpler times. Today, with growing data complexity, attribution models and rising customer acquisition costs, it's no longer enough.
Modern performance marketing isn't about chasing a high ROAS, it's about building balanced, profitable growth. Only then does advertising stop being a cost, and become an investment in the brand's future.
Want to go deeper, see the slides and get the full context behind these strategies? Be sure to watch the recording linked above. I covered these and many other topics during my talk at the third edition of Event Ecommerce.
Check out also:

Have a question about this article? Write to us.